By now, you’re familiar with these posts – we take a look at how the Caps are trending over the past month or so and how they stack up against the rest of the League.
Back in late November, the Caps looked like a team that was playing very well and getting commensurate results. Right before Christmas, their underlying numbers had slid a bit, but the results sure hadn’t. And by the end of January, they’d built a huge lead in the standings, and had seemingly gotten back on track in some of the “yellow flag” areas of concern.
Now here we are in the dog days of late winter, with February turning to March and the Caps’ lead over everyone almost certainly insurmountable… but there are some concerns creeping back in with the playoffs on the horizon. Overall, here’s where the Caps stack up against the rest of the League in our now-familiar 15 metrics (data via NHL.com, HockeyAnalysis and Puck On Net; click to enlarge all charts in this post):
That’s pretty much where they’ve been for a while now, and it sure seems as if this is the team that the Capitals are – a squad whose results may well outpace their good-not-great underlying numbers, thanks to terrific special teams, finishing talent and (we’re reasonably sure) goaltending:
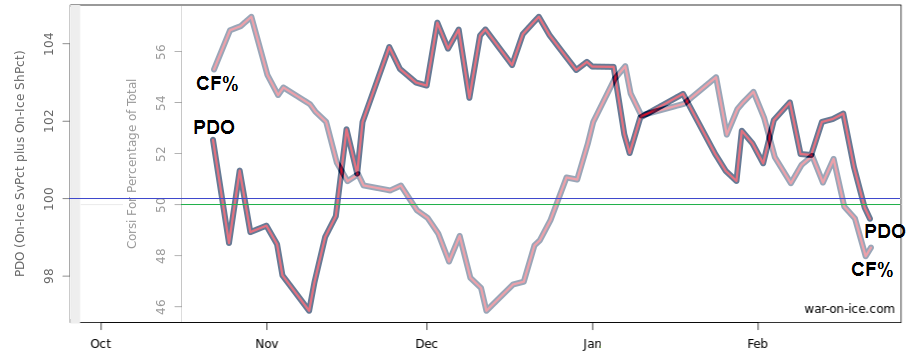
The number that jumps off that chart (besides all of those beautiful 1’s) is the drop in Score-Adjusted Corsi-For percentage, from ninth to 13th (in raw numbers, that drop was from 51.6 to 51.0). And it’s actually been a fairly ugly descent that, unlike with previous trends this season, ran alongside the team’s PDO. Take a look (ten-game rolling five-on-five numbers, via war-on-ice.com):
In their last ten games (since February 12), the Caps’ SACF% is just 48 percent, and they’re dead even in goal differential at five on five (20-20). As you can see from the chart above, the Caps’ ten-game SACF% is at its low point since cratering in December, which is… suboptimal. Their oft-high PDO hasn’t really been there to cushion the fall, either.
And yet, the Caps keep winning. But what’s been driving the falls in SACF% and PDO? Let’s take a look at the latter first:
As you know, PDO is simply the sum of the team’s on-ice shooting and save percentages. As you can see from the chart above (with League averages for shooting and save percentages represented by the green and blue lines, respectively), the Caps’ save percentage has dropped to well below League-average, while their shooting percentage has dropped, but is still a few ticks above the average. We’ve written about Braden Holtby’s bump-in-the-road, so no real need to rehash that here, but let’s just say that if he doesn’t right the ship in the next month or so, all of this will probably be academic come playoff time.
What about shot rates? Here are the Caps’ ten-game rolling score-adjusted five-on-five Corsi-For and -Against rates (note: the scale for the two is different, but what’s important here are the trends):
Shot rate-for has basically been coming down since the beginning of January, while shot rate-against has been going up over the last month or so. Not a good combination, obviously, and that’s why the CF% trend above is sharply downward over this span.
So… panic, right? Well, probably not. At least, not yet. Let’s remember that this is a Caps team that hasn’t played a particularly meaningful game (standings-wise, at least) for quite some time and this time of year can be challenging for any team. In fact, Barry Trotz has talked to Mike Babcock and Joel Quenneville about it and their similar experiences with teams that have helped themselves to big divisional leads, and they seem to have allayed his concerns.
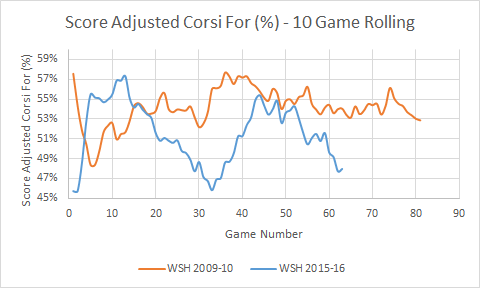
Then again, the 2009-10 Presidents’ Trophy Caps didn’t have a dip like this (like these two, in fact):
But these Caps do have a knack for “flipping the switch,” as it were, and we’ve seen it plenty, especially lately. You know the drill – start slow, fall behind, wake up, storm back, usually win. Fact of the matter is that the Caps have been a mediocre-at-best team in the first period of games:
As the games have progressed, the Caps have gotten better. Whatever the reason – their depth wearing down other teams, their interest level increasing over the course of sixty minutes, weathering other teams’ best shot early because of their lofty perch in the standings or their knowledge that they can get away with it – it’s a thing. (And, because you’re curious, they’re second in the League with a 62.7 CF% in overtime.)
And this third period dominance is one of the reasons that their terrific record in one-goal games might not be inflating their record as much as some might believe – it’s widely accepted that winning one-goal games isn’t necessarily a repeatable skill, but when you’re controlling a score-adjusted 55% of the shots in the third period of games, close ones may not quite be coin-flips. (Then again, that 2009-10 Caps team was in the bottom half of the League in one-goal win percentage despite being similarly dominant in third periods.) [For more on the Caps’ and their record in one-goal games, be sure to check out Pat Holden’s latest post over at RMNB.]
So what to make of the Caps as they stand right now? The last time we did this exercise, we closed with the following:
That’s pretty much exactly what happened – PDO crashed and so did their play. And yet… wins. As we noted in our December wrap:
All of that holds true today. That the Caps can keep winning even when they’re not at their best speaks to how good this team can be (and is). That they can skate with the Blackhawks and Kings and any other team you care to name and usually come out on top does too. Even if we haven’t seen the Caps consistently at their best in a while, make no mistake about it – it’s there.
Hopefully they can flip the switch when they need to.