Hey, look – it’s another one of these posts (April Edition).
Back in late November, the Caps looked like a team that was playing very well and getting commensurate results. Right before Christmas, their underlying numbers had slid a bit, but the results sure hadn’t. And by the end of January, they’d built a huge lead in the standings, and had seemingly gotten back on track in some of the “yellow flag” areas of concern. February was kinda ugly and here we are – with the playoffs looming – to look at March and the year-to-date for the Presidents’ Trophy-winning Caps.
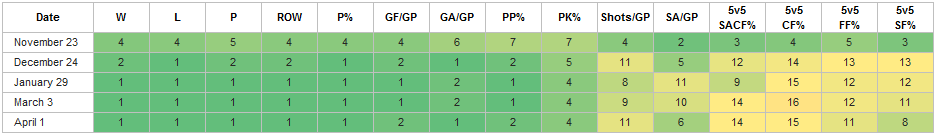
Overall, here’s where the Caps stack up against the rest of the League in our now-familiar 15 metrics (data via NHL.com, HockeyAnalysis and Puck On Net; click to enlarge all charts in this post):
No big changes here (unsurprisingly at this point in the season), and despite the “standings effects” that might have dragged down some numbers a bit, this is who the Capitals are – a team whose results may well outpace their middling-to-good underlying numbers, thanks to strong special teams, finishing talent and goaltending. Taking the month(ish)-by-month look, we can see where some small changes have come:
So what jumps out (other than all of those 1’s and 2’s)? Small improvements in shots-against and shots-for percentage, and a small slip in total shots-for. After nearly bottoming out in early March (Game 62 was March 1), the Caps’ play at even strength has improved, though their “puck luck” has dipped again after a small dead-cat bounce. Take a look (ten-game rolling five-on-five numbers, data via war-on-ice.com):
In their last ten games (since March 8, beginning with that L.A. game), the Caps’ SACF% is 51.5 percent (a not-bad high-point since the ten-game span that ended with Game 59 on February 24), but their PDO is 98.8, basically as low as it’s been since that nasty-looking dip in mid-November (Game 17). In fact, the Caps’ PDO over the last 16 games is just 98.4, so, despite a CF% of 50.9 (score-adjusted to 50.7), they’re in the red in goal differential, with 21 goals for and 24 against at fives.
A slight edge in shot attempts helped, of course, and their shots-on-goal advantage was even bigger (52.9%) but here’s the deal: with the shooting and save percentages the Caps managed over those 16 games, they’d have needed a SF% around 56% to break even in goals, and that number would easily lead the League in that metric. In other words, if your shots aren’t going in often enough and/or you’re not getting saves at a high enough frequency, it’s awfully hard to overcome.
So which is it – has the Caps’ offense run cold or are they not getting stops? Or is it both? Let’s take a look:
As you know, PDO is simply the sum of the team’s on-ice shooting and save percentages. As you can see from the chart above (with League averages for shooting (7.4%) and save percentage (.926) represented by the bright blue and red lines, respectively), the Caps’ goaltending has regressed to just about average, while shooting percentage has fallen off the table. More specifically, the Caps’ five-on-five shooting percentage over the last 16 games is just 5.6%, while their save percentage is .928 (and .937 over the last dozen, .945 if you throw out Philipp Grubauer‘s three starts). In other words, it looks as if Braden Holtby has righted the ship, which had to have been everyone’s biggest concern – make no mistake about it, this team will only go as far as he takes them.
What about shot rates? Here are the Caps’ ten-game rolling score-adjusted five-on-five Corsi-For and -Against rates:
Obviously, when the blue line is above the red here, the Caps are outshooting opponents, as they’ve begun doing again recently, but not nearly to the extent they were doing it for much of the season (that high point around game 43 came in mid-January). Of particular note, the Caps are currently off their shots-for peak by about 14%, but their shots-against have come down to a good number (their current 10-game score-adjusted CA60 of 50.1 would put them eighth in the League over the course of the season, while the CF rate would be middle-of-the-pack), thus a positive differential and a percentage above 50.
 Must Read
Just to hammer home an earlier point, the Caps’ most dominant 10-game stretch in terms of SACF% came early on, a span from October 17 through November 7 (Games 4 through 13) over which the Caps attempted a score-adjusted 57.3% of the shots (56.5% unadjusted). As you can see above, shot attempts-for were good (55.8), attempts-against were great (41.5). The Caps’ share of on-goal shots was even better – 57.7%. And yet, if the Caps have shot their current 10-game 5.6% over that span and stopped 92.8 percent of the shots on-goal, they’d have scored 14 goals and given up 13.
All of that domination and a one-goal advantage to show for it. Hockey can be silly sometimes. (As it was, they shot 8.8% and got a .908 save percentage, which provided a 22-17 edge in goals).
Look, you know where things stand right now – sometimes great teams play less than great hockey down the stretch. Sometimes they’re fine, sometimes they’re not. Sometimes they flip the switch, sometimes they don’t. And sometimes models that heavily weight recent performance predict that a ~120-point team will lose in the first round (which, incidentally, we know all too well can happen). But our now-familiar closing is as apt now as it ever has been:
Even if you haven’t seen it as often as you’d like lately, this Caps team is still a legitimate contender to win the Eastern Conference (which should go without saying, but doesn’t seem to these days). Their Vezina-hopeful goalie seems to have come around, and the offense shouldn’t be far behind. The defense is finally healthy and playing well.
All of the pieces are there.
No foolin’.