The Caps following defensive-zone face-off wins.
The Caps following neutral-zone face-off wins.
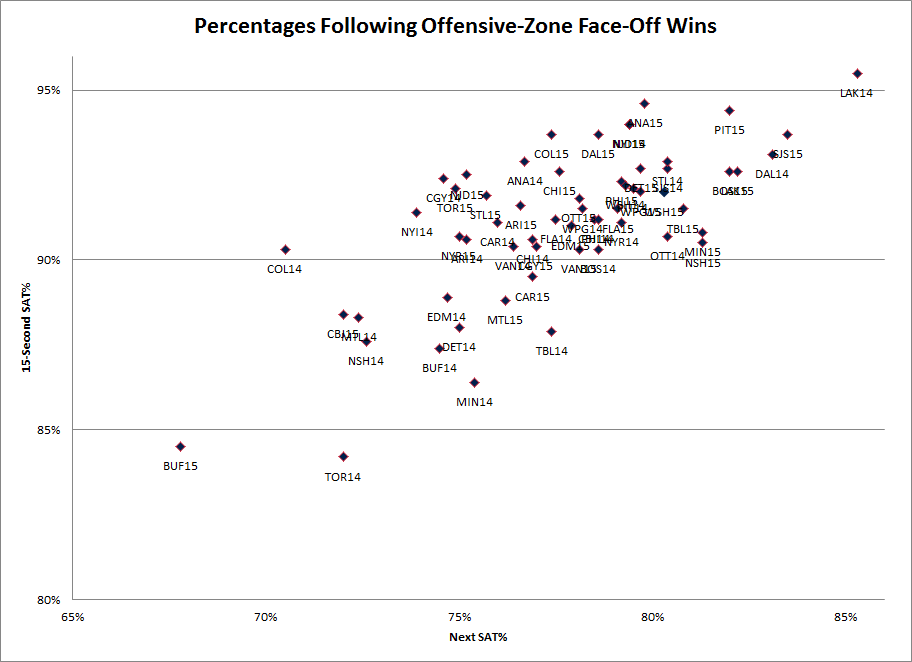
As we progress up the ice (left to right across your radio dial, as they say) you’re probably expecting a post about how the Caps fared following offensive-zone face-off wins. But really, there’s not that much “there” there (in terms of what we’ve been looking at) – over the last two seasons, 53 of 60 teams got the next shot attempt between 74 and 84 percent of the time and 57 got between 86 and 95 percent of the shot attempts over the next 15 seconds (and the teams are packed even tighter if we limit our look to last season). Here’s those past two seasons (click to enlarge):
For what it’s worth, the Caps fared well in both seasons, plotting at (79.3, 92.2) in 2013-14 and (80.3, 92.0) for this past campaign, which ranked them roughly top-third across the board.
Anyway, teams win face-offs in the offensive-zone and put themselves in a good position to do some damage. Shocking, right?
But what about when they lose those draws? How good are teams at getting pucks back and on net, turning advantageous position into possession?
Before Tyler Dellow (a.k.a. mc79hockey) was hired by the Edmonton Oilers last summer to help return them to “respectable NHL franchise” status, he’d written a post about how Bruce Boudreau‘s Ducks (and his Caps before them) were particularly adept relative to their peers in the wake of lost offensive-zone face-offs. Unfortunately, when Dellow was raptured up in the “Summer of Analytics,” his website disappeared and the Internet lost an incredible repository of data-driven insight.
But given how prolific and influential Dellow was, bits and pieces of his posts still exist, referenced in others’ work and discussed on message boards. Fortunately for us, scraps of that Boudreau post are floating around, allowing a peek into “the fantastic results that his teams achieve following 5v5 offensive zone faceoff losses.” As Dellow wrote for Sportsnet in criticism of the contract extension granted to then-Leafs bench boss Randy Carlyle (who would be fired midway through the following season):
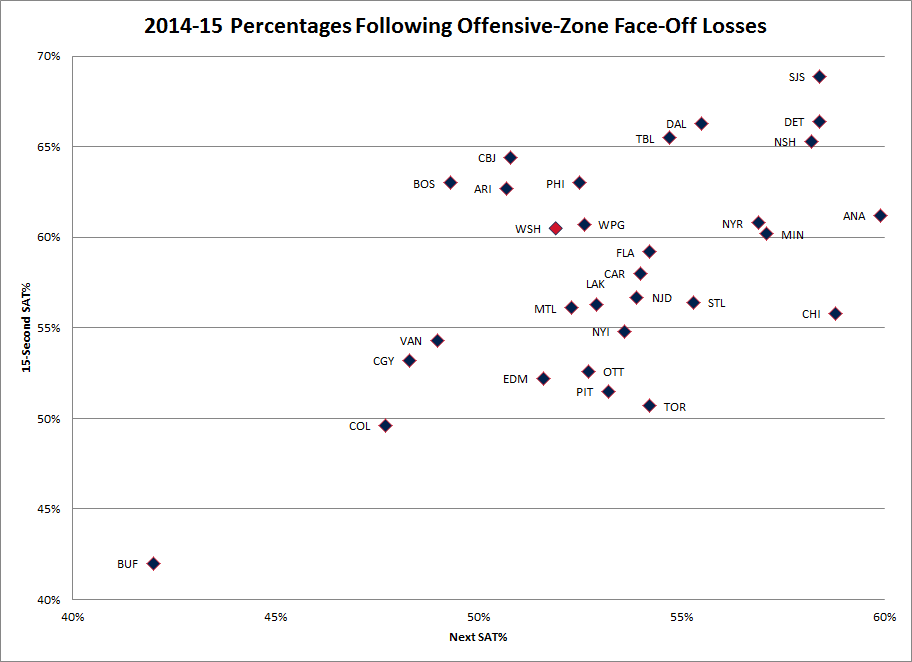
That’s borne out pretty clearly in Dellow’s data and in ours as well – here’s 2013-14:
Sure enough, there are the Ducks near the top of the League in 15-second SAT% and the Leafs towards the bottom of… wait a second. What’s that data point in the spot usually reserved for the outlier-awful Sabres?
Yep. That’s Adam Oates‘s Caps – dead last in Next SAT%, dead last in 15-second SAT% (and the only team to be outshot by opponents in the 15 seconds following an offensive-zone face-off loss). Woof.
We’ll get back to the Caps in a minute, but first a quick look at Ducks and what they do (forecheck) that other teams might not (retreat). Local stats blogger and good dude Arik Parnass seized on this same lost Dellow post back in January and did a good job of recreating it, including providing video examples to show that Anaheim post-offensive-zone-loss forecheck:
How great is that?
Contra Oates’s Caps, who would lose an offensive-zone draw and immediately drop back or apply token pressure that’s not going to win many pucks from NHL defenders and leaves the team so spread out that it’s unable to slow down an opponent through the neutral zone:
We could do a full post breaking down what’s wrong with this play (or this one or this one), but you get the point. What’s ironic, of course, is that dropping back would typically be seen as the safer, more conservative route. And it may prevent some highly visible and memorable odd-man rushes (or not – see below). But willingly yielding shots-against is going to catch up with a team sooner or later. And while it’s almost certainly more correlation than causation, of the eleven worst teams in terms of 15-second SAT% on that last chart, only Claude Julien in Boston and Jack Capuano in Brooklyn (ha) are still behind their teams’ respective benches.
So, to repeat a passage from our last post in this series, did it change for the Caps in 2014-15?
It did. (How could it not?)
The Caps upped their Next SAT% from 47.9% to 51.9% (up to a still-troubling 22nd in the League), but the huge improvement came in 15-Second SAT% – up from 46.5% to 60.5% (13th in the League). That 14 percentage-point improvement was the largest in the League by far, and the Next SAT% improvement was fifth-best.
How’d they do it?
Well, it wasn’t via a constant two-man forecheck, as this ugly sequence shows (granted, there are mitigating factors, but it’s another example of what can happen when you let teams break out with minimal pressure and bad reads):
(Nice secondary helper there, T.J. Oshie!)
Anyway, at an individual level, here’s how the Caps’ skaters looked following offensive-zone face-off losses (click to enlarge):
In terms of getting the puck back right away, Troy Brouwer and Nicklas Backstrom stood out a bit here (and Backstrom fared well relative to his teammates here in 2013-14 as well), then a big grouping of players and a drop-off to some third-paid defensemen and fourth-line forwards. Perhaps the third-pair and fourth-line were coached and/or were inclined to be a bit more conservative following offensive-zone losses than their teammates (not forechecking hard, not holding the point, etc.)… but then what’s Michael Latta doing with such a relatively solid Next SAT% (granted, it’s 58 draws we’re looking at here of 118 total… which raises the question of why Latta was on for 118 offensive-zone face-offs in the first place)?
As for 15-Second SAT%, it’s a similar story – a decent-sized grouping and a drop-off to some less-skilled players (surprising to see Andre Burakovsky where he is here, especially given his almost uniformly impressive rookie campaign). But check out Tom Wilson (again, relatively small sample – just over 100 offensive-zone losses). At some point, his good underlying numbers need to translate to production, but it says here he was a bit of a forechecking and cycling menace in 2014-15… which is what you’d hope for. All-in-all, we see eight forwards who were above 60% in 15-Second SAT% following an offensive-zone face-off loss, which is a dramatic improvement over 2013-14’s… zero (unless you want to count Dustin Penner; otherwise, Jay Beagle of all people led the way at 53%, which probably emphasizes the small sample issue when dealing with fourth-liners’ offensive-zone starts).
In 2014-15, the Caps made significant positive strides in their percentages in the immediate wake of an offensive-zone face-off loss, all the way up to… mediocre. That’s a huge step in the right direction, of course, but the team seems well-equipped to be even better here – they’re loaded with capable forecheckers, have largely mobile defensemen (well, five out of six ain’t bad), and have a terrific netminder backstopping the operation. So why not take some more chances and leverage those territorially advantageous opportunties a bit more? Low-to-medium risk/high reward sounds like a gamble that’s going to be worth taking in the long-run.