With Labor Day just passed and hockey season less than a month away, let’s take a moment to reflect upon the biggest labor story of the NHL’s offseason: the initial rejection, and subsequent contingent-on-a-CBA-amendment acceptance of a revised contract for Ilya Kovalchuk to play for the New Jersey Devils. As one would expect, the entire saga, particularly the ultimate rule-shifting decision, has resulted in a significant amount of discussion and debate among NHL pundits and fans.
Of course, no one’s more impacted by changes to the collective bargaining agreement than the players themselves, which is why it made sense that new Los Angeles King and player union representative Willie Mitchell had some thoughts on the issue. Mitchell told The Province, “We have a big gap in our union where you have the star player and the blue-collar player. All those top-end guys are getting paid more and more and the bottom-end guys are getting less and less. Maybe if we come to something more level, it might help the rest of our union.”
For this, Province writer Tony Gallagher took Mitchell to task, labeling the defenseman a “socialist” and making light of the Grade II concussion that ended Mitchell’s season in January. Classy. (For his efforts, Gallagher was given an exhaustive smakedown courtesy of Jewels from the Crown, which I highly recommend.)
What Gallagher didn’t do in his piece was examine whether or not Mitchell’s claim was, you know, correct; whether or not the NHL’s existing financial structure overwhelmingly favors the league’s elite players, or favors those players more than the pre-salary cap financial structure. That’s what we decided to take a look at, after the jump.
Using USA Today’s salary database, we decided to look at salary distribution for the 2009-10 NHL season, as well as for 2003-04 – the last year before the lockout. Here’s what we found:
| 2003-04 | Mean | 10th Pct. | 25th Pct. | 50th Pct. | 75th Pct. | 90th Pct. | 95th Pct. | Gini* |
| Salary | $1,780,768 | $450,000 | $600,000 | $1,100,000 | $2,200,000 | $4,200,000 | $5,848,805 | .480 |
| % of Mean | 100.0 | 25.3 | 33.7 | 61.8 | 123.5 | 235.9 | 328.4 | – |
| % of Median | 161.9 | 40.1 | 54.5 | 100.0 | 200.0 | 381.8 | 531.7 | – |
| Share of Total | – | 2.2 | 6.6 | 18.2 | 39.1 | 64.1 | 77.9 | – |
| 2009-10 | Mean | 10th Pct. | 25th Pct. | 50th Pct. | 75th Pct. | 90th Pct. | 95th Pct. | Gini* |
| Salary | $2,211,550 | $550,000 | $735,000 | $1,300,000 | $3,475,000 | $5,112,500 | $6,390,000 | .456 |
| % of Mean | 100.0 | 24.9 | 33.2 | 58.8 | 157.1 | 231.2 | 288.9 | – |
| % of Median | 170.1 | 42.3 | 56.5 | 100.0 | 267.3 | 393.3 | 491.5 | – |
| Share of Total | – | 2.3 | 6.6 | 16.9 | 42.8 | 70.1 | 83.1 | – |
[Ed note: The Gini coefficient is measure of dispersion that compares actual wealth or income distribution with a hypothetical perfect equality scenario. Ratios approaching 1 (or 100, depending on how it’s written) are more unequal, while ratios approaching zero are more equal, with zero itself representing perfect equality.]
For the NHL’s “working class,” not much has changed. The relationship between the the salary of players in the 10th and 25th percentiles to the league’s mean and median isn’t all that different; the share of the total amount paid out to players in the 10th and 25th percentiles is almost identical. The “middle class” – the 50th percentile – appears to be slightly worse off (since we see the 25th percentile’s share holding constant but the 50th percentile’s dropping a bit), but whether it’s enough of a difference to account to a trend is debatable. Yet the Gini coefficient was lower in 2009 than 2003 — why?
The answer is that the NHL’s elite aren’t getting nearly as high a percentage of the overall salary pie as they were in 2003. Salaries of the top five percent of NHLers dropped significantly in relation to both the League mean and median, and the same group saw its share of the total amount paid out drop from 22.1% to 16.9% (i.e. the bottom 95% of NHL players saw its share increase from 77.9% to 83.1%).
Most of the benefit seems to have gone to what could be considered the NHL’s upper-middle class — players who make more than most of their peers, but aren’t in the upper echelon. For example, players in the 75th percentile saw their pay jump relative to the League mean and median jump from 124% and 200% to 157% and 267%, respectively. The higher percentages of total salary paid out in the 75th and 90th percentiles with equal or lower payouts for players at or below the median suggests that most of the money that was being paid out to the truly elite (salary-wise) players in 2003 is now being paid to players in the next tier or two, but isn’t quite trickling down to the masses. Visually, it looks something like this:
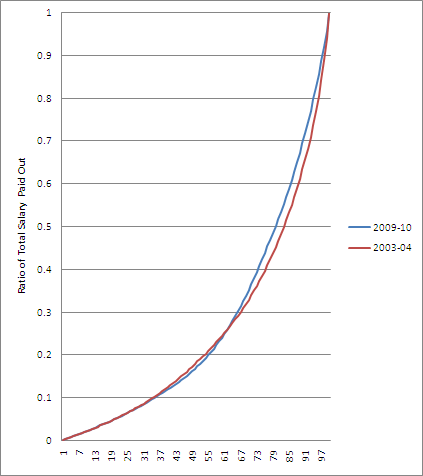
To think of it another way, imagine a tubular balloon being squeezed a bit at the midway point towards the top and a bit from the top. The resulting bulge in between? That’s (more or less) your 75th percentile.
What that means is that, although pay in the NHL could probably be considered more equal in today’s NHL that in 2003, most NHLers aren’t seeing that much of a benefit and, in fact, the league’s “middle class” may be worse off than they were before. Now, that doesn’t necessarily mean that Gallagher’s point that the league’s best players are the ones hurt most by the current CBA is incorrect — but maybe it does mean Willie Mitchell’s not all that crazy.